Hey all you cool cats and kittens, let's talk about the Binary Ninja debugger plugin (BNDP).
Here's what it looks like:
I want position the demos first, so skip to the end for specifications and discussions of BNDP's architecture.
Demo: Function parameters and stack variables populated at runtime
(I want to show this really bad, but the live memory view won't let you change anything about the struct pointed to by $rsp/$rbp.) IS THERE ANOTHER WAY?
Demo: Switch/Case Discovery
The static analysis is adept and finding switch statements and their corresponding jump tables, but with considerable effort it can be fooled into missing a case. If a new case is observed at runtime, analysis is updated:
Demo: Unfound Call Site
If a function is purposely hidden, analysis might miss it. But during runtime, analysis can be told the address of call destinations, informing function search.
Prior to the call ebx, address 0x100000f25 is just data. But once this instruction is reached, Binja wisens up:
Demo: Indirect Jump Annotation
With the debugger.extra_annotations setting, function starts get annotated with context information and targets of indirect calls are logged as comments:
Demo: Connect to MAME
TODO, probably dreaming
Demo: Count Opcodes
The UI is not the exclusive consumer of BNDP's API. You can write "headless" scripts too. Here's a simple example that runs md5 and single-steps while counting all the opcodes executed:
Demo: CLI Debugger
The headless API is complete enough that a respectable little CLI debugger can be made in a few hundred lines.
Multiplatform Architecture
BNDP can connect to three backends: gdb, lldb, and dbgeng. The target is decoupled from BNDP in the first two modes, communicating with RSP protocol over a socket. Theoretically any platform for which a gdbserver exists can be debugged. In dbgeng mode, BNDP is runtime linked to Windows debugger engine and can debug local binaries.
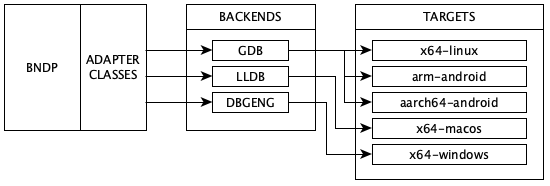
Supported Platforms
BNDP is tested on x64-linux, arm-android and aarch64-android binaries in gdb mode, x64-macos binaries in lldb mode, and x64-windows binaries in dbgeng mode.
You should have success on the 32-bit x86 versions of the above binaries, but they're not as rigorously tested as 64-bit.
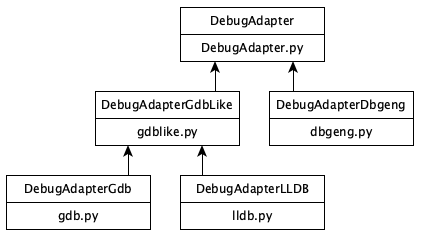
Adapter Classes: Generalizing Backends
Each of the adapters is expected to provide some primitive operations, like reading registers, stepping, breakpoints, etc. The comprehensive, but still short, list is the abstract functions in class DebugAdapter in DebugAdapter.py.
With classes and inheritance, we're able to factor out common behavior among adapters. For instance, GDB and LLDB have much in common, with LLDB speaking an augmented RSP protocol. The current class diagram has plenty of room for an additional adapter and its corresponding backend:
Higher level operations like "step over" are provided by some backends (like dbgeng) but not others (like gdb and lldb). For these, the operation is synthesized with primitive operations. "Step over" might involve disassembling to detect call or loop instructions and setting a one-shot breakpoint. "Go up" might involve reading the stack and setting a one-shot breakpoint at the return address.